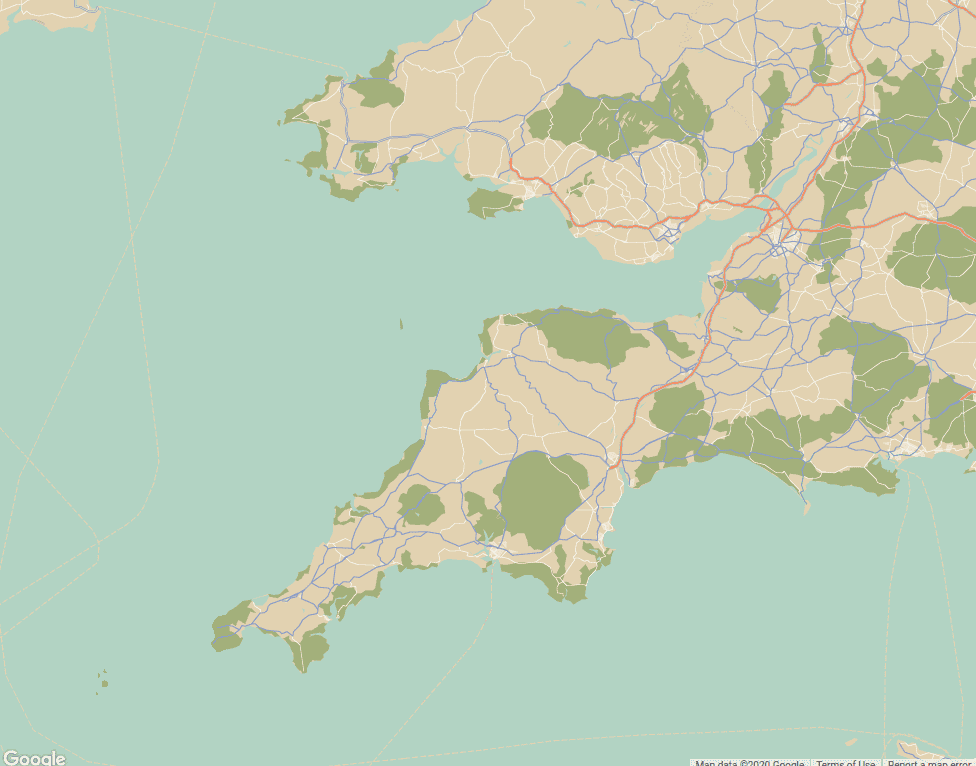
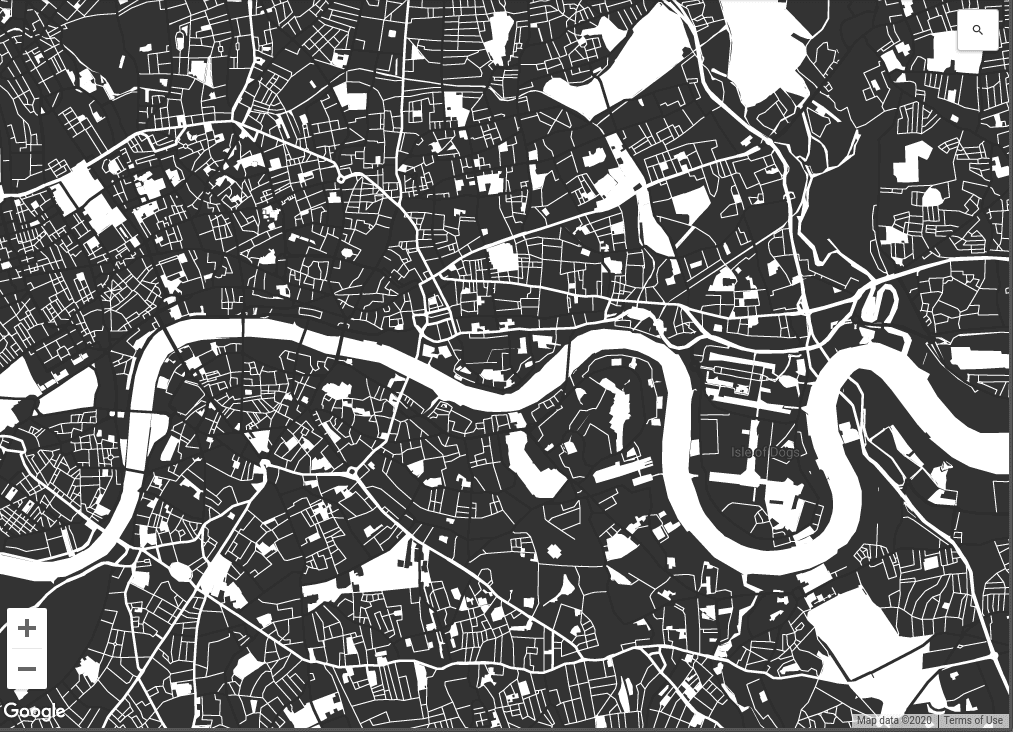
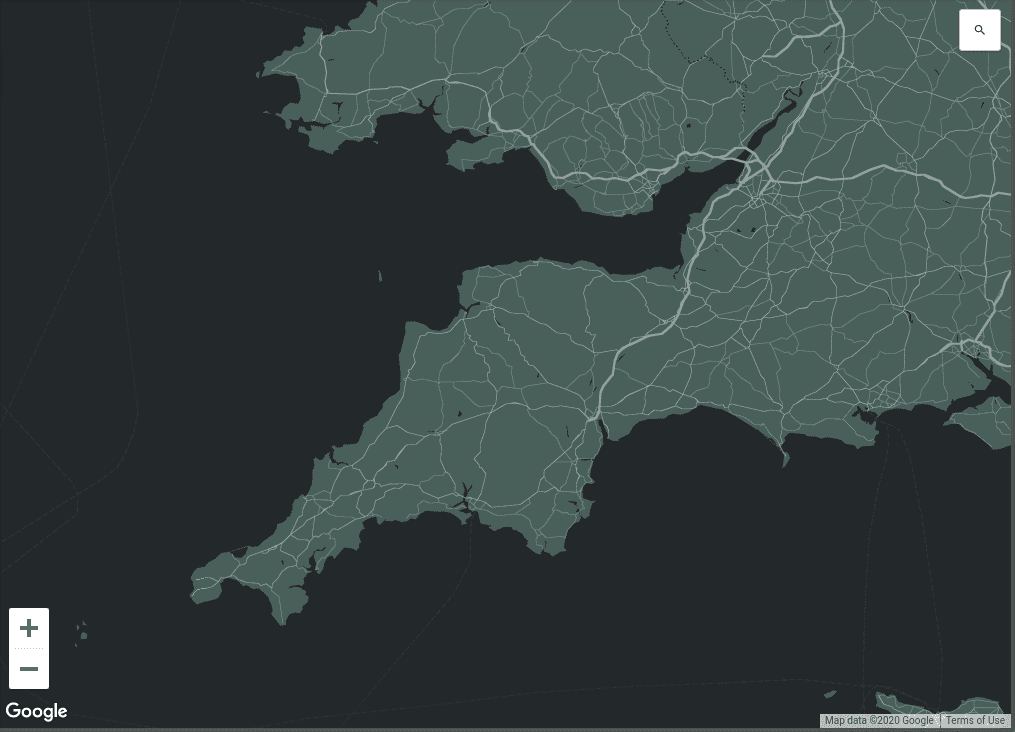
If you have to put a Google Map on your web page, then it needn't stick out like a sore thumb. You can style it to best match the rest of your site, and it's easy.
Here's a JavaScript function that will fetch a map using the API and insert it into a DOM element with 'id="map'.
function initMap(location) {
  let latitude = parseFloat(location.coords.lat)
  let longitude = parseFloat(location.coords.lng)

  let coords = new google.maps.LatLng(latitude, longitude)

  let options = {
    zoom: zoomExtents(searchRadius),
    center: coords,
    zoomControl: false,
    mapTypeControl: false,
    streetViewControl: false,
    fullscreenControl: false,
    styles: myMapStyles,
  }

  //generate map to given location
  map = new google.maps.Map(document.querySelector("#map"), options)
}
I'm not going to get into initiating the Google client, or how to parse location coordinates. You can go to the docs for that. Let's focus on the options that we pass as a second argument to our API call.
Here you can see that I have turned off all additional controls to de-clutter the map window. These can be distracting, and perhaps offer users functionality that they just don't need.

The final value is styles. Here I have referenced a variable that I store in a different file, as it's quite large and would clutter up the code to have it sat there. See below ...
;[
  {
    elementType: "geometry",
    stylers: [
      {
        color: "#ebe3cd",
      },
    ],
  },
  {
    elementType: "labels.text.fill",
    stylers: [
      {
        color: "#523735",
      },
    ],
  },
  {
    elementType: "labels.text.stroke",
    stylers: [
      {
        color: "#f5f1e6",
      },
    ],
  },
  {
    featureType: "administrative",
    elementType: "geometry.stroke",
    stylers: [
      {
        color: "#c9b2a6",
      },
    ],
  },
  {
    featureType: "administrative.land_parcel",
    elementType: "geometry.stroke",
    stylers: [
      {
        color: "#dcd2be",
      },
    ],
  },
  {
    featureType: "administrative.land_parcel",
    elementType: "labels",
    stylers: [
      {
        visibility: "off",
      },
    ],
  },
  {
    featureType: "administrative.land_parcel",
    elementType: "labels.text.fill",
    stylers: [
      {
        color: "#ae9e90",
      },
    ],
  },
  {
    featureType: "landscape.natural",
    elementType: "geometry",
    stylers: [
      {
        color: "#dfd2ae",
      },
    ],
  },
  {
    featureType: "poi",
    elementType: "geometry",
    stylers: [
      {
        color: "#dfd2ae",
      },
    ],
  },
  {
    featureType: "poi",
    elementType: "labels.text",
    stylers: [
      {
        visibility: "off",
      },
    ],
  },
  {
    featureType: "poi",
    elementType: "labels.text.fill",
    stylers: [
      {
        color: "#93817c",
      },
    ],
  },
  {
    featureType: "poi.park",
    elementType: "geometry.fill",
    stylers: [
      {
        color: "#a5b076",
      },
    ],
  },
  {
    featureType: "poi.park",
    elementType: "labels.text.fill",
    stylers: [
      {
        color: "#447530",
      },
    ],
  },
  {
    featureType: "road",
    elementType: "geometry",
    stylers: [
      {
        color: "#f5f1e6",
      },
    ],
  },
  {
    featureType: "road.arterial",
    elementType: "geometry",
    stylers: [
      {
        color: "#fdfcf8",
      },
    ],
  },
  {
    featureType: "road.arterial",
    elementType: "labels",
    stylers: [
      {
        visibility: "off",
      },
    ],
  },
  {
    featureType: "road.highway",
    elementType: "geometry",
    stylers: [
      {
        color: "#f8c967",
      },
    ],
  },
  {
    featureType: "road.highway",
    elementType: "geometry.stroke",
    stylers: [
      {
        color: "#e9bc62",
      },
    ],
  },
  {
    featureType: "road.highway",
    elementType: "labels",
    stylers: [
      {
        visibility: "off",
      },
    ],
  },
  {
    featureType: "road.highway.controlled_access",
    elementType: "geometry",
    stylers: [
      {
        color: "#e98d58",
      },
    ],
  },
  {
    featureType: "road.highway.controlled_access",
    elementType: "geometry.stroke",
    stylers: [
      {
        color: "#db8555",
      },
    ],
  },
  {
    featureType: "road.local",
    stylers: [
      {
        visibility: "off",
      },
    ],
  },
  {
    featureType: "road.local",
    elementType: "labels",
    stylers: [
      {
        visibility: "off",
      },
    ],
  },
  {
    featureType: "road.local",
    elementType: "labels.text.fill",
    stylers: [
      {
        color: "#806b63",
      },
    ],
  },
  {
    featureType: "transit.line",
    elementType: "geometry",
    stylers: [
      {
        color: "#dfd2ae",
      },
    ],
  },
  {
    featureType: "transit.line",
    elementType: "labels.text.fill",
    stylers: [
      {
        color: "#8f7d77",
      },
    ],
  },
  {
    featureType: "transit.line",
    elementType: "labels.text.stroke",
    stylers: [
      {
        color: "#ebe3cd",
      },
    ],
  },
  {
    featureType: "transit.station",
    elementType: "geometry",
    stylers: [
      {
        color: "#dfd2ae",
      },
    ],
  },
  {
    featureType: "water",
    elementType: "geometry.fill",
    stylers: [
      {
        color: "#b9d3c2",
      },
    ],
  },
  {
    featureType: "water",
    elementType: "labels.text.fill",
    stylers: [
      {
        color: "#92998d",
      },
    ],
  },
]
Nothing fancy here, you can see exactly what's happening, however the file is long and boring. Luckily Google don't expect you to write one of these configs yourself. Thankfully they have created this fantastic tool that has a nifty user interface for styling it as you wish. You can adjust the detail of roads, labels and landmarks, as well as all the colours of every park or school or whatever. You can even customise the icons used for things. All these options though, can eventually lead to a bit of a dogs dinner.
Snazzy Maps
Snazzy Maps to the rescue! Since building a few sites with maps, I have just found this awesome site that has a library of different styles ready to go. You can search by styles, and/or colours to best match your site. Not only that, you can just about configure every option you'll need with their new Build A Map section. This helps you set up every option that I spoke about above and more. I'm blown away.
Conclusion
Snazzy Maps is a great tool simplifying a process that used to be a bit tricky. However for the seasoned dev, and a demanding client you can always tweak the settings to be just how you need them.


